


Food Cart Culture in Queens
Exploring how Street Food Vendors reflect the change in culture and peoples of Queens, New York
Understanding our Neighbors
A diverse life in Queens, NY.
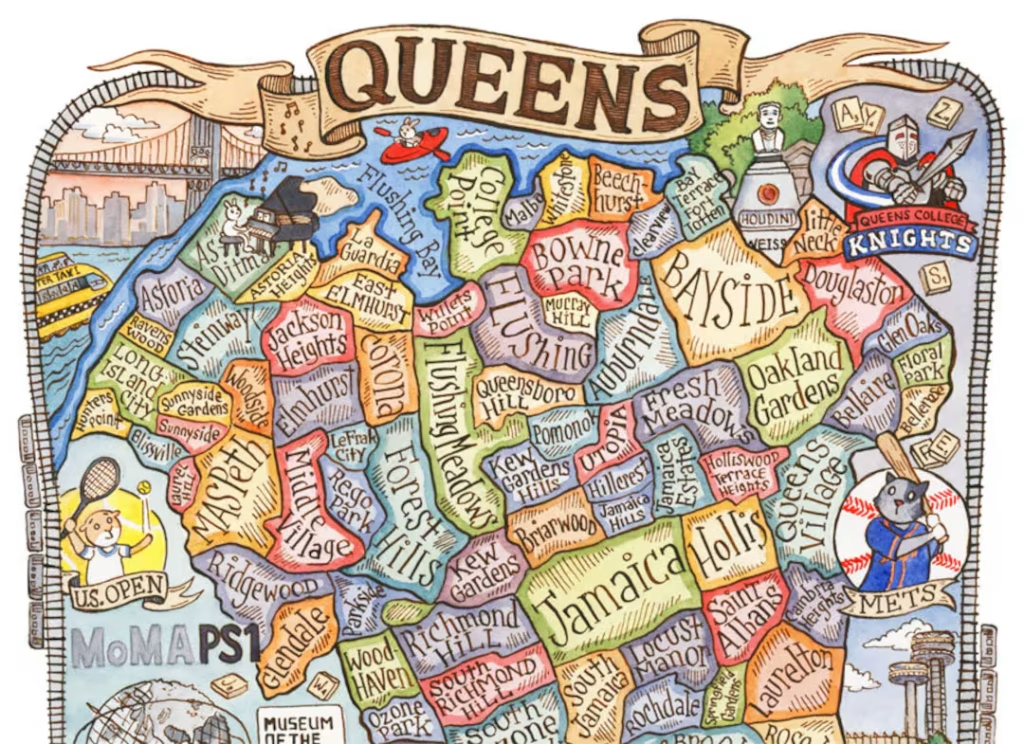
Queens, NY is considered to be the most ethnically and linguistically diverse place in the world, with over 130 languages spoken and representation from over 120 countries. Almost 50% of the 2.4 million residents living in the borough are foreign born.
This is because New York City has historically been a major hub for immigration to the U.S. Although- these immigration patterns are constantly shifting. In the 1800s, New York was met with an influx of Northern European immigrants from countries like the Netherlands and Ireland. In the Mid 1900s, New York saw a wave of Southern European immigrants. As politics across the world changed, the country welcomed Asian and South American immigrants as well.
These shifts are Important to Track
In a 2024 report the Immigration Research Initiative released data showing that of New York City’s 20,500 Food Vendors – over 96% of them are immigrants. What that means is that
vendors are a living record of demographic shifts.
Studying food vendors, the foods they sell, in the locations they work in, can reveal the ways a city is populated and the change in demographics at a time.
Neighborhood Analysis
In our two weeks of field research, we studied the culture, language, and food vendors in three distinct neighborhoods. We observed how people interacted with each other and with us as outsiders through street interviews. We asked vendors about their customers, their own background in the neighborhoods where they worked, and why they chose to come to the United States. These interview questions helped us understand how each neighborhood evolved in the years since its development.
Long Island City & Astoria
Astoria has a large historic background as a part of NYC Industrial economy. With majority waterfront property, LIC was a port for ships and cargos to transport goods made in factories in Queens. Since the era of deindustrialization, Astoria properties and streets have had numerous new rezoning.
Jackson Heights
At the beginning of the 20th century, the Jackson Heights neighborhood was home to majority middle class white residents, like many American suburbs of the era as discrimination shaped who could live where. After INA in 1965, the area became a major destination for immigrants from South Asia and Latin America coming into the U.S. White residents increasingly moved out of the neighborhood, leaving behind space for large ethnic enclaves to form.
Flushing
Flushing has a long history as an important and busy commercial center in Queens. In the late 20th century, Flushing became a major hub for immigrants from China, Korea, Taiwan, and other Asian communities, driving the prominent white residential demographic out over time. Life in Flushing is largely centered around immigrant driven demographic change.
Tracking Demographics

Jackson Heights
- Jackson Heights experienced a major demographic shift, dropping from a 98.5% white population in 1960 to a 11.4% white population in 2023.
- There has been a major demographic shift towards a foreign born hispanic population. This was in part due to the Hart-Celler Act in 1965 which gave way to a more ethnically diverse population.
- This strong immigrant culture is still represented in the various food vendors with around100 vendors on average in the commercial corridors.
Flushing
- Flushing experienced a slight demographic change from 41.2% to a 19.7% white population from 2000 to 2023.
- The foreign born population continues to climb, reaching 58.7% in 2023, with neighborhoods consisting of Asian, Hispanic, and White residents.
- Many shops and businesses were abandoned by a receding white population but many Asian immigrants moved into these neighborhoods and put money back into the community.
Astoria
- Astoria was different from the other two areas, experiencing an upward shift in terms of its white population from 41.9% in 2000 to 48% in 2023.
- The foreign born population has seen a significantly decreased to around 38%.
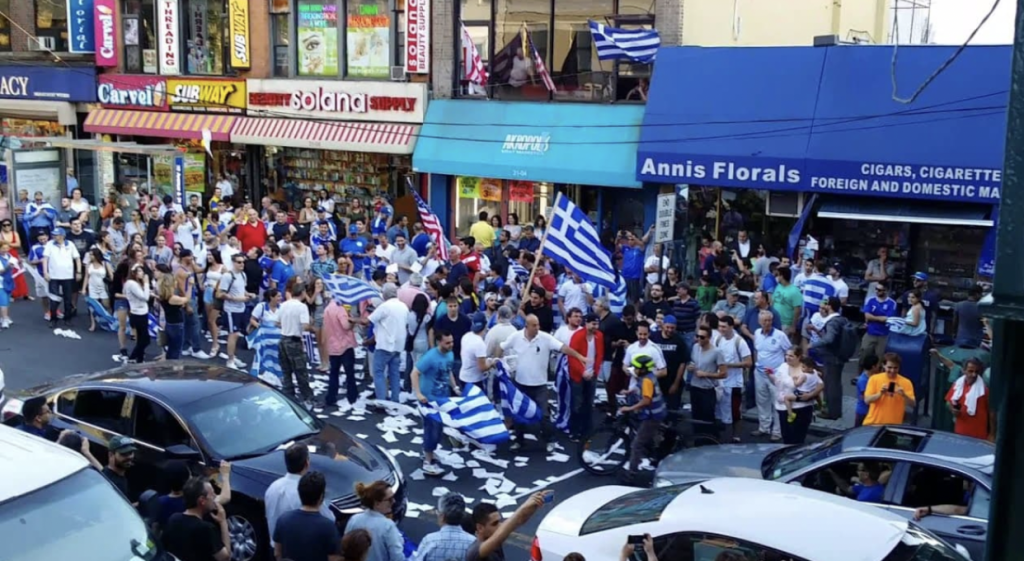
- The population of Astoria has remained stagnant with no notable rise in recent years, with a majority Greek population.
Economic and Legal Factors
Many food vendors face economic and legal hurdles, but in recent years, collective action has resulted in many breakthroughs for these vendors and the communities they serve. However, vendors still deal with many hurdles that shape their businesses and the demographics that they cater to.
Mobile Food Vendors
| Permitted | Unpermitted |
| 25% | 75% |
General Merchandise Vendors
| Licensed | Unlicensed |
| 63% | 37% |
Legal Challenges
According to the data in the tables, sourced from the Immigration Research Initiative, a sweeping majority of food vendors in New York City are unpermitted. This can pose many challenges for vendors, since they are faced with criminal misdemeanor charges, heavy fines, and law enforcement raids. In many cases, food vendors are not proficient in english, which makes navigating an already difficult legal system significantly worse.
However, the main issue behind this large percentage of unpermitted vendors is the artificial cap placed on street vending permits. In 1983, the limit was set at 3,000 full term limits. This strict enforcement of permits has now been lifted in recent years. New York City passed the Street Vendor Reform Package, which will create an additional 10,500 permits for food vending by 2031.
Economic Challenges
One of the biggest economic factors that affect street vendors are rising rent prices in the neighborhoods they cater to. Throughout our trips to different neighborhoods in Queens, there was a notable amount of vendors who did not live in the areas they were selling their food. According to the Immigration Research Initiative, the median profit food vendors make in both the winter and summer seasons ranges from around $500-$1000 per week. The range for the average rent prices in Jackson Heights, Astoria, and Flushing for a 1-2 bedroom apartment was $1,800-$2,100. At best, that is around three weeks of profit per month that goes into rent alone. These high costs are why many native vendors are pushed out of living in their neighborhoods and communities, which can affect the communities they serve as well.
Flushing

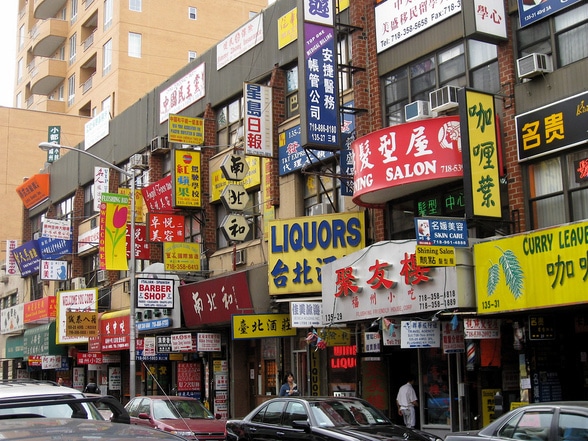
The overwhelming majority of food vendors in this hub are Chinese immigrants, and the foods served cater to the predominantly East Asian demographic. The streets are defined by charcoal-grilled lamb and chicken skewers (chuan’r) heavily seasoned with cumin and chili, freshly steamed sweet sweet egg cakes, roasted chestnuts, and hand-pulled noodles or dumplings.
While talking to the vendors, one major point of concern was the rising cost of living, along with increased Department of Sanitation crackdowns on unlicensed street vendors. Many vendors were also apprehensive when we approached because they thought we were part of the city government.


One neighborhood change noted was a shift from Korean to Chinese immigrants in downtown Flushing (around Roosevelt Ave). Korean immigrants have moved northward toward Northern Blvd, while areas like Main St have become majority-Chinese. The vendors we interviewed also expressed that there is now more tourism in Flushing, so their customer base has diversified. Additionally, Flushing’s small food stands and street vendors have now become more favorable over “western” stores such as Walgreens, which has notably shut down while local 99-cent stores flourish next to the original location.
Jackson Heights
Jackson Heights is an intersection of three main cultures. The beautiful thing about the neighborhood is how the communities live in harmony within their own distinct “mini-enclaves”. We mostly found Nepali, Bengali, and Mexican cuisine, with the food ranging from the popular “pani puri” snack , hearty momos, and freshly made tacos by the train that packed a spicy punch.
While talking to the vendors, we learned that there was indeed changes to the neighborhood, mostly negative. There were complaints about a rise in crime as well as police presence. Many vendors were also hesitant to talk to us, which happened frequently for many reasons. Some vendors were unsure of who we were, others were not able to overcome the language barrier, or they were simply too busy.

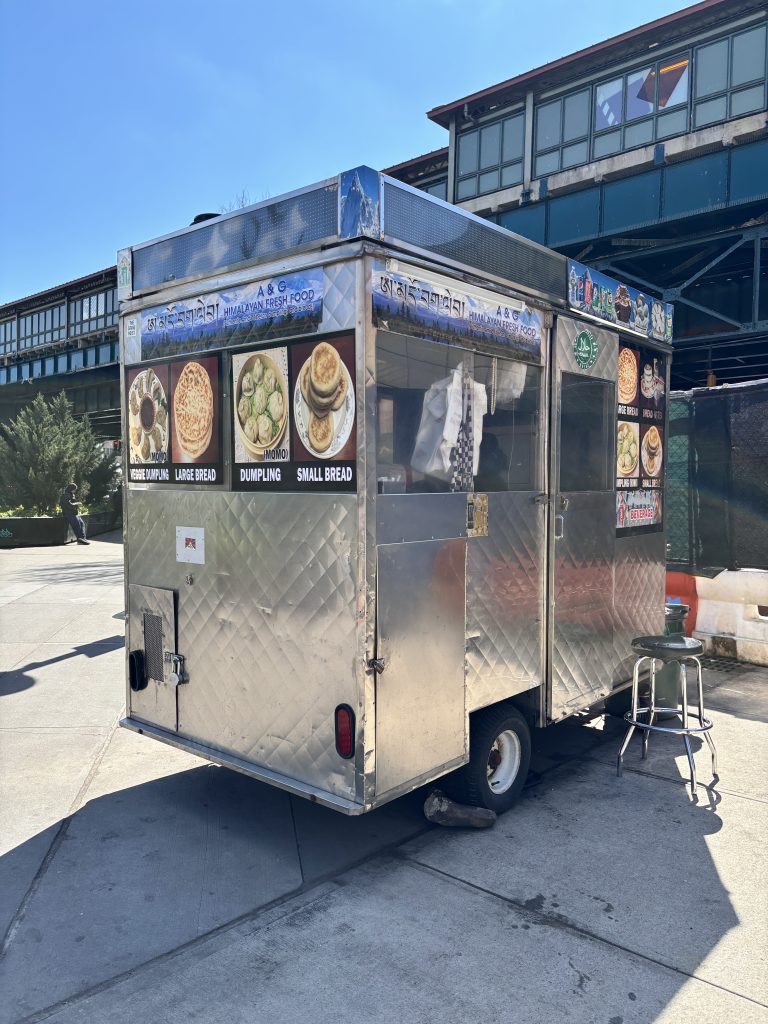
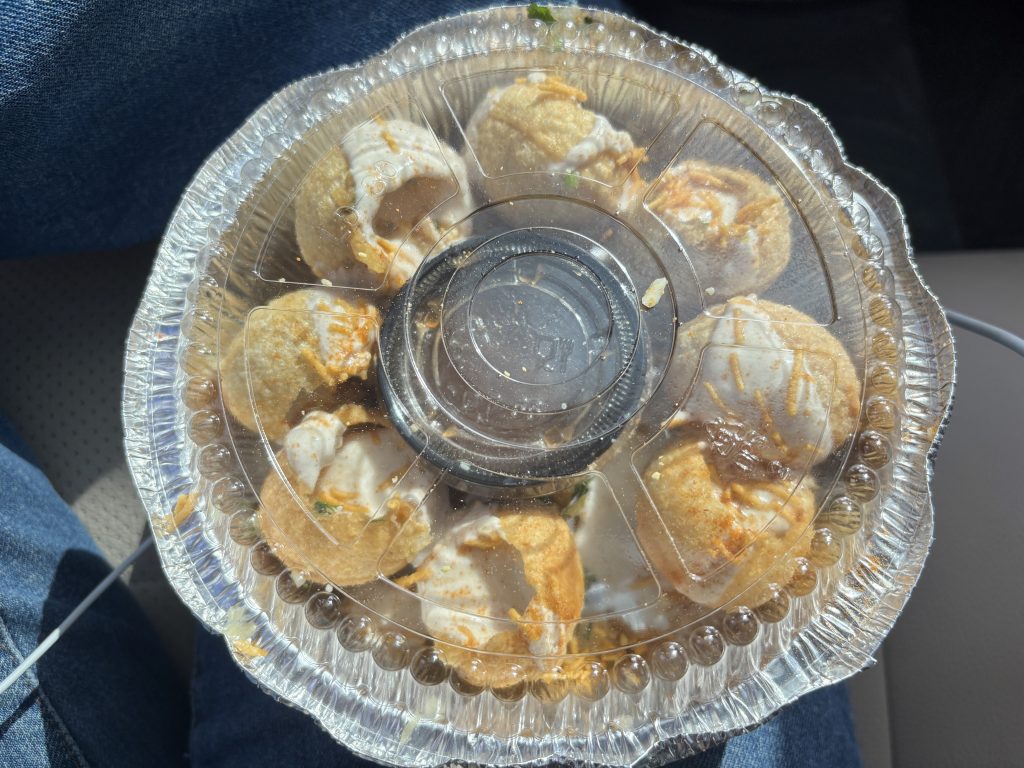
The most interesting pattern we saw in Jackson Heights was the continuous innovation in the food truck scene. Many trucks were own and ran by younger generations, with eye catching designs and trendy menus that attracted locals and tourists alike. This suggests that the food truck business thriving with increased competition and dinner options.
Astoria
During our trips to the neighborhood, we saw a similar trend to that of the vendors– the vendors we interviewed were largely Hispanic (Mexican) and Asian (Himalayan and Indian)
The area is historically Greek and Italian, however long-term vendors noted an influx of due people moving into the neighborhood searching for a more affordable cost of living.
Further, the Hispanic and Asian vendors we spoke to tended to be newer to the neighborhood compared to the Greek vendors we spoke to, signaling a less established community.
Long Island City


Despite LIC being known for its Greek population, similarly to Astoria, they were not represented much among street vendors. Rather, the Greek population was represented by restaurants and storefronts.
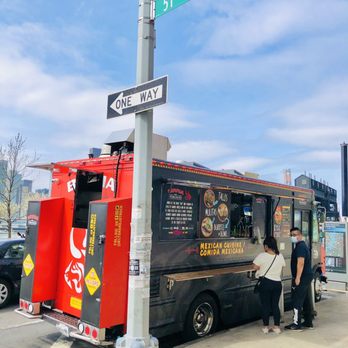
Most popular among the vendors was Mexican cuisine, followed by Bengali and Himalayan vendors.
When interviewing the vendors, some commented that a significant portion of customers were young, hailing from multiple nearby schools.
Our Findings
What Food venders tell us about current demographics in the neighborhoods we studied
Flushing
Flushing is the most ethnically uniform of our three neighborhoods– So much so that it has become a second Chinatown. The predominantly Asian community is reflected not only in the food vendors but also in local businesses. Even without knowing the number, it is clear to see that Flushing is a stable and thriving ethnic enclave.
Jackson Heights
Jackson Heights was the most divided neighborhood we visited. On one end, we saw streets dominated by different Asian food vendors, to a back drop of Asian businesses, and on the other end, we observed a strong community of Hispanic vendors, with storefronts advertising in Spanish. Both communities are able to succeed and exist in the neighborhood, albeit separately.
Astoria & LIC
Astoria was the neighborhood that had the most dissonance between what population demographic and that of the vendors we observed. While the notable Greek community can be seen in storefront restaurants, the vendors were almost entirely Hispanic and Asian. This may signal that the demographics of the neighborhood might change in the future with incoming ethnic residents.
The development of ethnic enclaves
The food vendors we interviewed gave considerably different answers depending on the neighborhood they operated in. With some vendors, we discussed how long they had been in the neighborhood, others commented on the rising cost of living, but across the three different neighborhoods we explored one thing remained largely consistent– when asked why they choose to settle in their particular location, a majority of vendors cited the established ethnic community as a determining factor. This phenomenon is called Chain Migration. Incoming immigrants follow in the steps of previous immigrants–often family or friends. Immigrants of the same ethnic origin tend to cluster together to ease the transition of moving to a new place.
How ethnic enclaves shape surrounding areas
As new ethnic groups move into a neighborhood, they introduce new languages, customs, and cultural identities to the area. Motivated by a desire for cultural familiarity and economic security, immigrants tend to cluster and support one another. The formation of these communities keeps a culture alive in a foreign environment. Slowly, a neighborhood will begin to shape itself around the culture of the predominant ethnic community that resides there. Shops and storefronts shift to cater towards the needs of the community, as with flushing, for example, locally owned ethnic businesses will replace generic businesses owned by larger corporations. These businesses are able to thrive because of the support of the immigrant community.

