In our previous data we found statistics on the demographic of the community, below are some images:
Economic/Housing Contributors
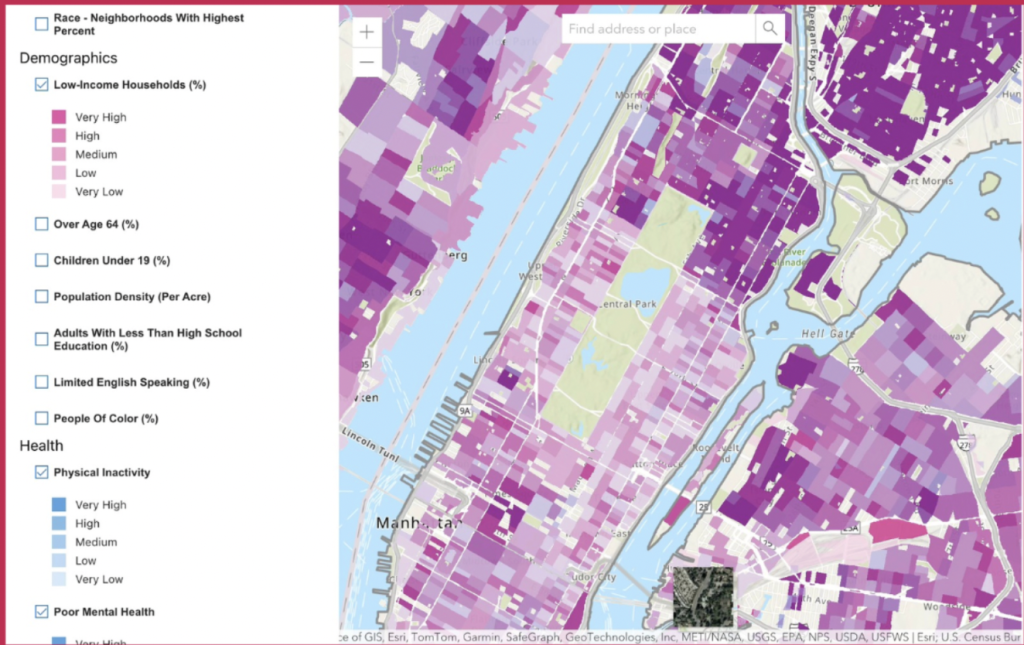
- Rent Burden in East Harlem: 38.5%
- Median Household income: 33,564 compared to 60,879 across NYC
- Poverty rate: 23.7% compared to 19.7% across NYC
- Homes with no maintenance problems: 47% (meaning that more than half of households have maintenance problems)
- Homes with roach infestation: 30% compared to 24% across NYC
People of Color

- Likely to be obese in East Harlem by race:
- Black: 34%
- Hispanic: 33%
- White: 18%
- Other: 17%
Limited English Speaking
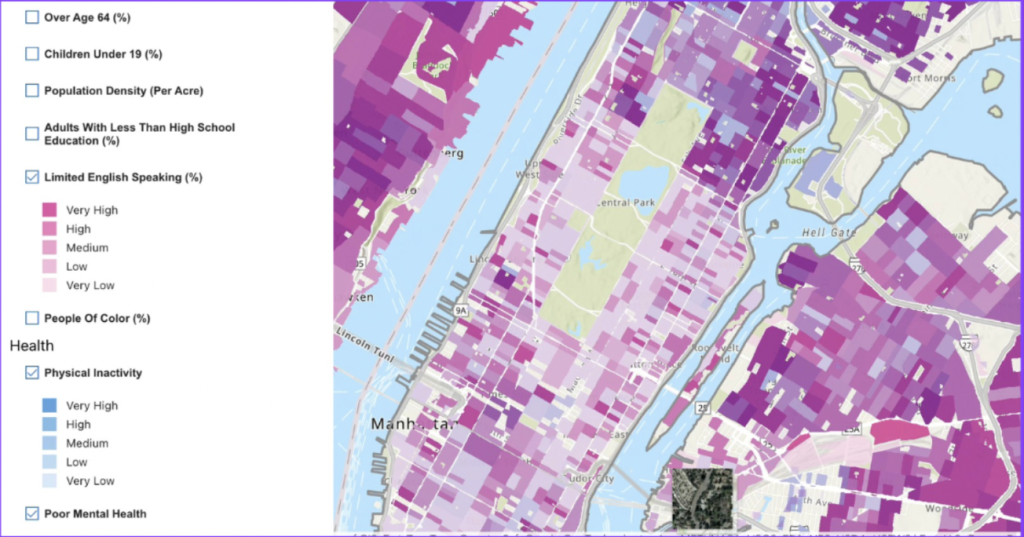
- Limited English: 20.3%
- Additionally, most community organizations such as food pantry’s require identification such as African Services Committee, the Bailey House Food Pantry, the Beth Hark Christian Counseling Center-Food Pantry, Chilis on Wheels, etc.
Health Statistics

Below is a pie chart of the different types of places to get food we observed on our walk in East Harlem from 110th to 125th street.
